The Reliability Loop
3 Reliability Tools Every Engineer Uses, and How They Connect
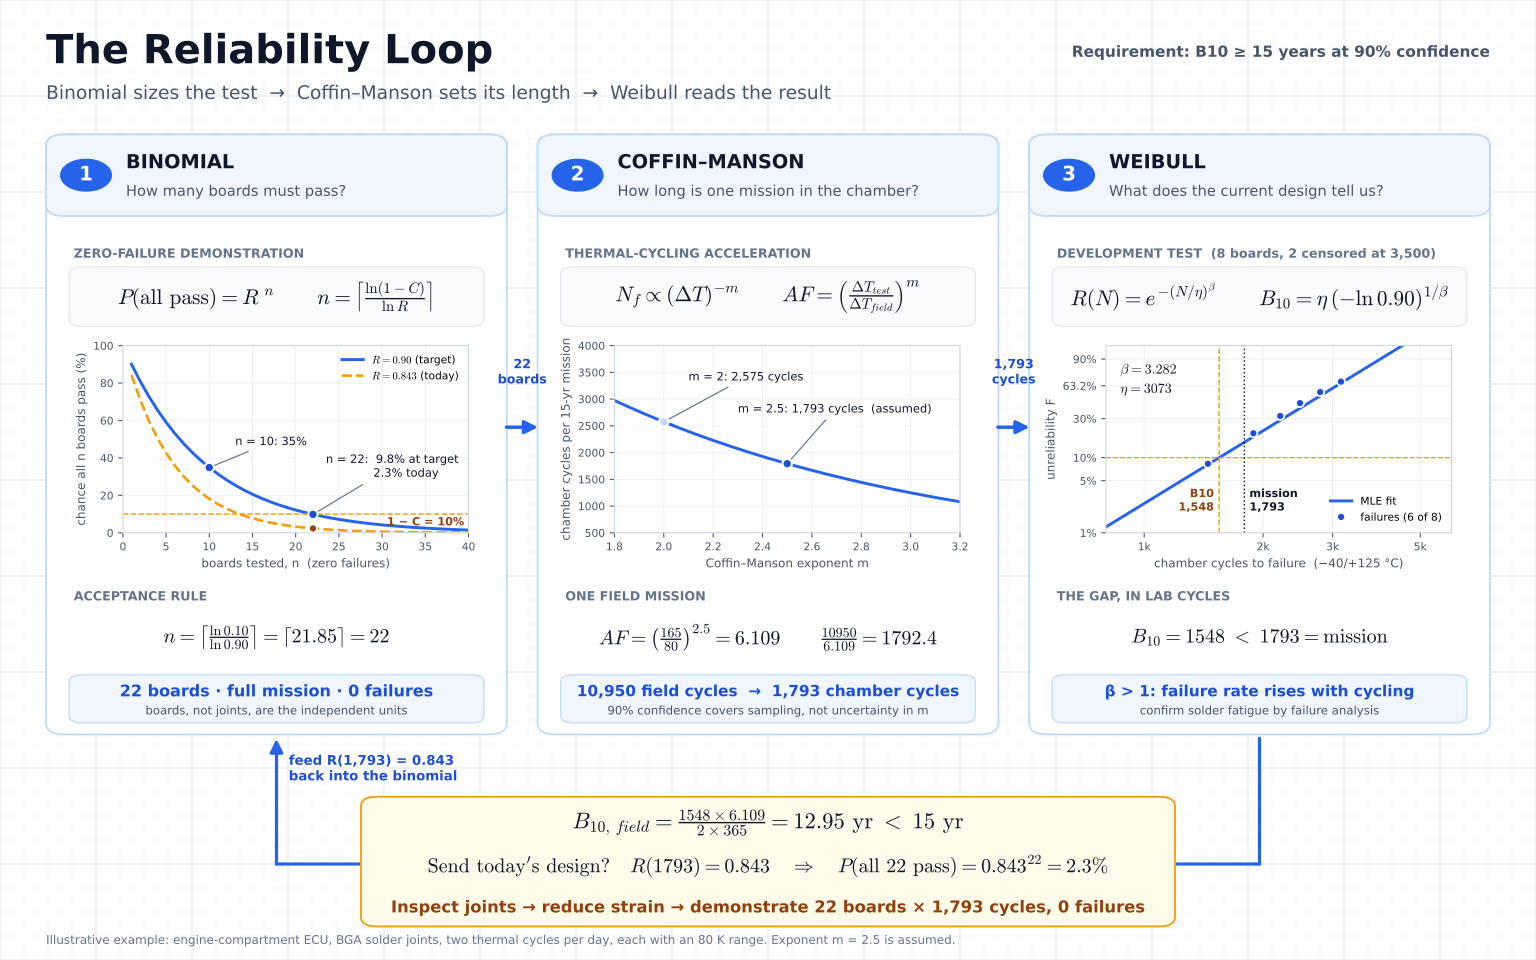
Three calculations show up in almost every reliability test plan: binomial sample size, Coffin–Manson acceleration and Weibull analysis. Each answers a different question. Sample size says how many units must pass, Coffin–Manson says how long each one must run, and Weibull says what the data already tell you about whether they will. Used together, they form a loop: the requirement sets the test, the test produces data, and the data show whether the design is ready.
This article works one example through all three. The proposed test calls for 22 boards to survive 1,793 thermal cycles each. Eight development boards can already tell us whether that is a good use of chamber time.
Consider an engine-compartment electronic control unit (ECU). Daily temperature swings strain the solder joints between a ball grid array package and its circuit board, and a fatigue crack can eventually interrupt electrical continuity. For this example, the requirement is that at least 90% of boards retain continuity through 15 years under the specified thermal mission. In life-distribution terms, that is B10 ≥ 15 years. The team wants to demonstrate that target at 90% one-sided confidence.
Tool 1: Binomial sample size — how many boards must pass?
At the end of one mission, each board has one outcome, pass or fail. If the true probability of surviving the mission is , and boards are independent with the same survival probability, the chance that all pass is . That is the zero-failure case of the binomial distribution.
At the target boundary of 90% reliability, ten boards can all pass about 35% of the time. To demonstrate the target at 90% confidence, the plan needs to bring that probability down to 10% or less.
The acceptance rule is 22 representative boards, each completing the full mission, with zero failures. Define the continuity-loss criterion and how it will be monitored before the test. Several joints on one board share materials, assembly history and thermal exposure, so counting each joint as an independent board would overstate the evidence.
Run your own zero-failure plan: set the target reliability and confidence, and get the number of units that must pass.
Open the Sample Size Calculator →Tool 2: Coffin–Manson acceleration — how long is one mission in the chamber?
The field profile assumes two complete thermal cycles per day, each with an 80 K peak-to-trough range. Using 365 days per year, 15 years gives 10,950 field cycles. The chamber cycles between −40 °C and +125 °C, a 165 K range.
For this solder-fatigue example, use a simplified Coffin–Manson relation in which cycles to failure scale with temperature range as . With an assumed exponent (labelled in the Reliatools Coffin–Manson calculator), the acceleration factor in cycles is
A field mission therefore takes chamber cycles. Round up to 1,793 cycles per board so every board receives at least one modeled mission.
The exponent deserves as much scrutiny as the chamber settings. At , the same development data below imply a field B10 of about 9 years. At , they imply 13 years. Check that the exponent represents the package and solder system, that both profiles exercise the same fatigue mechanism, and that differences in peak temperature, ramp and dwell allow this simpler model. The 90% binomial confidence level covers sampling uncertainty under the plan. It does not quantify uncertainty in the acceleration factor.
Turn your field and chamber temperature swings into an acceleration factor for your own thermal-cycling test.
Open the Coffin–Manson Calculator →Tool 3: Weibull analysis — what does the current design tell us?
Before committing 22 boards to a demonstration, test the current design to learn where its life distribution sits. In this illustrative development test, eight boards ran under the chamber profile. Six lost continuity at 1,450, 1,890, 2,210, 2,480, 2,790 and 3,150 cycles. Two still passed at 3,500 cycles. Those two supply right-censored observations, as each survived at least that long.
A two-parameter Weibull maximum-likelihood fit using all eight boards gives a shape and characteristic life chamber cycles. For cycle count ,
The fitted failure rate rises with cycling. Inspect the joints on boards that lost continuity to determine whether solder fatigue caused the opens. The fit and the acceleration factor both assume one failure mechanism, so if inspection finds mixed causes, refit the data by cause. Scaling the fitted B10 to the field gives
What would happen if we sent the current design straight into the 22-board demonstration? At 1,793 cycles, the fitted Weibull curve predicts that about 84% of boards will still pass. If that estimate holds, the chance that all 22 independent boards pass is about 2.3%.
That gives the team a reason to inspect the failed joints before committing another 22 boards to the chamber. The demonstration is deliberately hard to pass. A design sitting exactly at the 90% target passes only 9.8% of the time, and a design needs at 1,793 cycles to pass with an 80% chance. Thus, the revised design should show that margin in development before the 22 boards go in.
Fit your own failure and suspension data to get β, η and B-lives, and see where your design sits today.
Open the Weibull Calculator →Close the loop at the design review
The current design's estimated B10 is 13.0 years against a 15-year target. The same gap is visible in the lab, as the estimated tenth percentile is 1,548 cycles while the required mission is 1,793. With eight development boards, this is a point estimate. A 90% one-sided likelihood-ratio lower bound on B10 is about 970 cycles, or about 8 field years, so the data cannot support the 15-year target yet.
That finding changes the next test. First inspect the joints on boards that lost continuity and evaluate a strain-reduction option, such as a package change or underfill, once the inspection supports solder fatigue as the cause. When a candidate revision is selected, check that its failure mechanism and acceleration model still apply. Then run the planned demonstration on 22 independent boards of that revision, each through at least 1,793 cycles, with zero failures allowed. This gives the team a clear distinction between the life it predicts today and the evidence it needs for release.
Try all three tools in Reliatools
Technical references
- NIST/SEMATECH Engineering Statistics Handbook · Assessing Product Reliability
- NIST/SEMATECH · Weibull distribution
- ASQ Reliability and Risk Division · Zero-failure reliability calculations
Related calculators
- Sample Size Calculator
Size a test by what it must prove: success run, MTBF, Weibayes, A/B and more.
- Coffin-Manson Calculator
Estimate fatigue life from thermal cycling for solder joints, interconnects and constrained assemblies.
- Weibull Probability Plot
Fit 2-parameter Weibull to failure and suspension data; get beta, eta and B-lives.